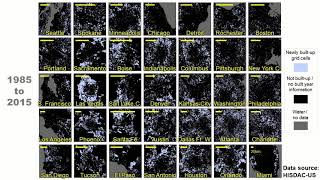
The discussions prominently feature appreciation for the detailed, high-resolution datasets used to map urban growth and land use over 200 years, with mentions of visualization tools and geospatial programming being common. Words like 'exciting,' 'big day,' and references to new papers and animations illustrate enthusiasm and acknowledgment of the data's significance in advancing spatial history and urban studies.
AgreementModerate agreement
Most discussions reflect positive recognition of the dataset's value and relevance for urban and historical studies.
InterestHigh interest
Posts show high enthusiasm, emphasizing visualization, geospatial analysis, and urban development trends, indicating strong interest.
EngagementHigh engagement
Many commenters explore technical methods, share visualizations, and reference research applications, demonstrating deep engagement.
ImpactModerate impact
The discussions highlight the potential of this dataset to influence urban planning, historical research, and geospatial analysis, though some focus more on methodology than direct societal impact.
Abstract in brief
The study develops detailed historical datasets tracing land development in the U.S. from 1810 to 2015, using a large database of building information to map where built-up areas were at different points in time.
These datasets have a high spatial resolution of about 250 meters and are updated roughly every 5 years, providing a valuable resource for analyzing long-term urban and land use changes.
The data, part of the Historical Settlement Data Compilation, are publicly accessible and enable new types of research exploring how the built environment has evolved over 200 years across the United States.]
Yesterday was a big day! Two new papers out about the development of urban spaces and new HISDAC data released. Check them out here:
https://t.co/5AOOEoBv8A
& here:
https://t.co/o0VAd0SEdu
And awesome animation by @JohannesHUhl1 here:
https://t.co/RkQt0TNLVM
Jan 28, 2021 · 18 likes · 10 shares · 932 followersView post →
DC
Dylan Connor
@Dylligent · X
Paper 1: https://t.co/OAw10x6nf2
Paper 2: https://t.co/E97SN72LBT
Jan 29, 2021 · 10 likes · 3 shares · 1,510 followersView post →
JU
Johannes H. Uhl
@JohannesHUhl1 · X
Visualizing the long-term urban growth in 35 U.S. cities from 1900 to 2015 using HISDAC-US data (https://t.co/4dcNz9ELfP) and #geospatial #python, part 1/3. #urbanization #urban #planning #historical #GIS #geopython #digitalhistory #spatialhistory #dh #land #consumption https://t.co/bycMl0l1Nx
This animation illustrates urban growth in 35 US cities from 1810 to 2015, based on detailed historical settlement data with high spatial resolution, providing insights into long-term land use and urban development…
This video presents a detailed visualization of urban change in 35 U.S. cities from 1810 to 2015, based on high-resolution datasets. It illustrates land development, urban sprawl, and spatial growth over 200 years.
This video presents animated visualizations of land development in the United States from 1810 to 2015, based on detailed historic datasets. It highlights how the built environment has evolved over two centuries…
Visualizing the long-term urban growth in 35 U.S. cities from 1900 to 2015 using HISDAC-US data (https://t.co/4dcNz9n9Rf) and #geospatial #python, part 3/3. #urbanization #urban #planning #historical #GIS #geopython #digitalhistory #spatialhistory #dh #land #consumption https://t.co/JrNhqa5Nzu
Visualizing the long-term urban growth in 35 U.S. cities from 1900 to 2015 using HISDAC-US data (https://t.co/4dcNz9n9Rf) and #geospatial #python, part 2/3. #urbanization #urban #planning #historical #GIS #geopython #digitalhistory #spatialhistory #dh #land #consumption https://t.co/rvPveDM4UY
Visualizing the long-term urban growth in 35 U.S. cities from 1900 to 2015 using HISDAC-US data (https://t.co/4dcNz9ELfP) and #geospatial #python, part 1/3. #urbanization #urban #planning #historical #GIS #geopython #digitalhistory #spatialhistory #dh #land #consumption https://t.co/bycMl0l1Nx
RT @stats4geo: Paper 1: https://t.co/OAw10x6nf2
Paper 2: https://t.co/E97SN72LBT
Jan 29, 2021 · 3 shares · 2,350 followersView post →
SA
SPARC at ASU
@SPARC_ASU · X
RT @stats4geo: Paper 1: https://t.co/OAw10x6nf2
Paper 2: https://t.co/E97SN72LBT
Jan 29, 2021 · 3 shares · 591 followersView post →
SA
SGSUP at ASU
@ASU_SGSUP · X
RT @stats4geo: Paper 1: https://t.co/OAw10x6nf2
Paper 2: https://t.co/E97SN72LBT
Jan 29, 2021 · 3 shares · 2,015 followersView post →
DC
Dylan Connor
@Dylligent · X
Paper 1: https://t.co/OAw10x6nf2
Paper 2: https://t.co/E97SN72LBT
Jan 29, 2021 · 10 likes · 3 shares · 1,510 followersView post →
MM
Meryl Mims
@merylmims · X
RT @AEBraswell: Yesterday was a big day! Two new papers out about the development of urban spaces and new HISDAC data released. Check them…
Jan 29, 2021 · 10 shares · 1,612 followersView post →
DB
Dr. Sue Lowerre-Barbieri
@BarbieriSue · X
RT @AEBraswell: Yesterday was a big day! Two new papers out about the development of urban spaces and new HISDAC data released. Check them…
Jan 28, 2021 · 10 shares · 1,177 followersView post →
JB
Joanna Blaszczak
@jrblasz · X
RT @AEBraswell: Yesterday was a big day! Two new papers out about the development of urban spaces and new HISDAC data released. Check them…
Jan 28, 2021 · 10 shares · 1,776 followersView post →
LD
Lisa Dilling
@LisaD144 · X
RT @AEBraswell: Yesterday was a big day! Two new papers out about the development of urban spaces and new HISDAC data released. Check them…
Jan 28, 2021 · 10 shares · 1,604 followersView post →
EL
Eli Lazarus
@envidynxlab · X
RT @AEBraswell: Yesterday was a big day! Two new papers out about the development of urban spaces and new HISDAC data released. Check them…
Jan 28, 2021 · 10 shares · 830 followersView post →
SQ
shuhong qin
@QinShuhong · X
RT @AEBraswell: Yesterday was a big day! Two new papers out about the development of urban spaces and new HISDAC data released. Check them…
Jan 28, 2021 · 10 shares · 28 followersView post →
VS
Victoria Scholl
@scholl_victoria · X
RT @AEBraswell: Yesterday was a big day! Two new papers out about the development of urban spaces and new HISDAC data released. Check them…
Jan 28, 2021 · 10 shares · 592 followersView post →
EG
Evan Goldstein
@ebgoldstein · X
RT @AEBraswell: Yesterday was a big day! Two new papers out about the development of urban spaces and new HISDAC data released. Check them…
Jan 28, 2021 · 10 shares · 1,043 followersView post →
KL
Kai Lorenzen
@FisheriesProf · X
RT @AEBraswell: Yesterday was a big day! Two new papers out about the development of urban spaces and new HISDAC data released. Check them…
Jan 28, 2021 · 10 shares · 1,025 followersView post →
AS
Anna Braswell - coastalecosystems on bsky social
@AEBraswell · X
Yesterday was a big day! Two new papers out about the development of urban spaces and new HISDAC data released. Check them out here:
https://t.co/5AOOEoBv8A
& here:
https://t.co/o0VAd0SEdu
And awesome animation by @JohannesHUhl1 here:
https://t.co/RkQt0TNLVM
Jan 28, 2021 · 18 likes · 10 shares · 932 followersView post →
ED
Earth Syst Sci Data
@ESSD_journal · X
New data description paper: Fine-grained, spatiotemporal datasets measuring 200 years of land development in the United States https://t.co/SuZ72SdcPe